
Representing 3D space digitally can be a challenging task. The most common way to process visuals about our world comes in the form of a 2D image, either from a photograph or video. Capturing 3D images might be more common than you think. Sensors using technologies such as LiDAR or radar do this. These sensors often produce data in the form of point clouds. In this blog, we will walk you through;
- What point clouds are.
- How point cloud data is created.
- What kind of problems can be tackled using point clouds.
Lyhyesti suomeksi: Tutkat, lidarit ja muut anturit ovat kustannustehokas tapa tuottaa pistepilviä, eli moniulotteisia pistejukkoja. Lue tästä tarkemmin, miten pistepilvidataa luodaan ja millaisia ongelmia voidaan ratkaista pistepilvien avulla.
What are point clouds?
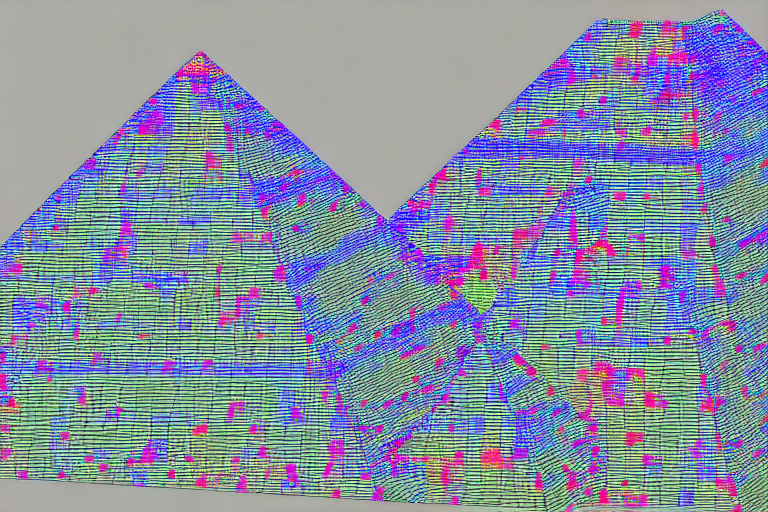
Point clouds are simply collections of points in space. Most of the time we are talking about 3D space, but a 2D scatterplot could also be considered a point cloud. The same goes for a higher dimensional space.
There are two important characteristics of point clouds. First, a point cloud is unordered. This means that the set of points can be shuffled and put in any order and it would still be the same point cloud. In other words, the first point is unrelated to the second point. This is not the case in regular photographs, two pixels that are next to each other are related to each other. You cannot shuffle them around and still get the same picture. This difference is important to remember when discussing point cloud algorithms later.
The second characteristic is that the space in which the point cloud exists needs to have some way to calculate the distance between two points. The most commonly used space is 3D Euclidean space where each point has an x,y, and z coordinate.
How are point clouds created?
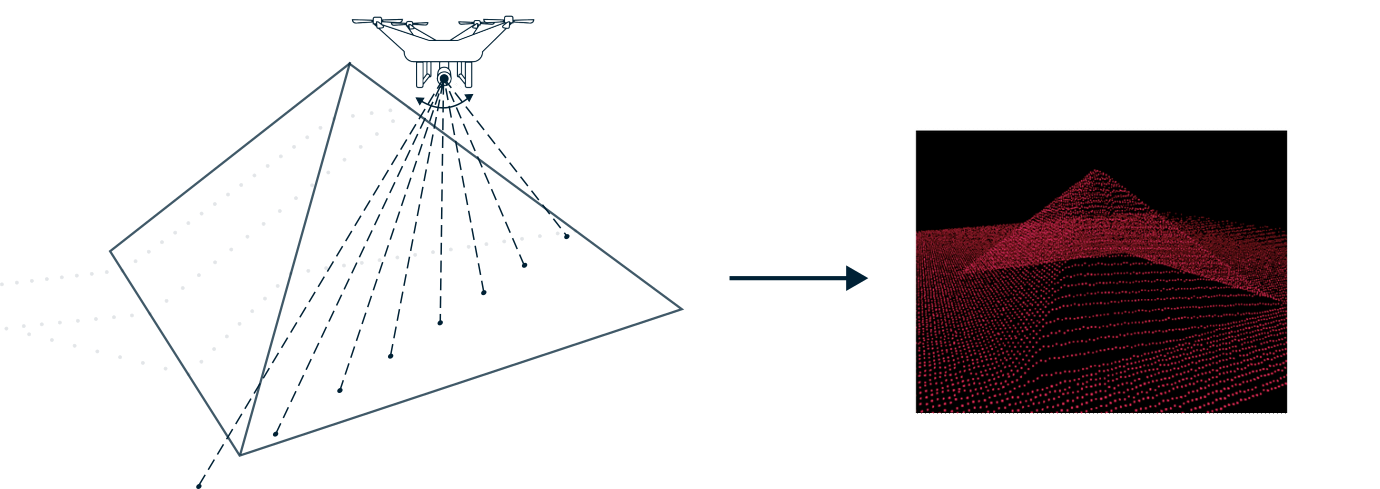
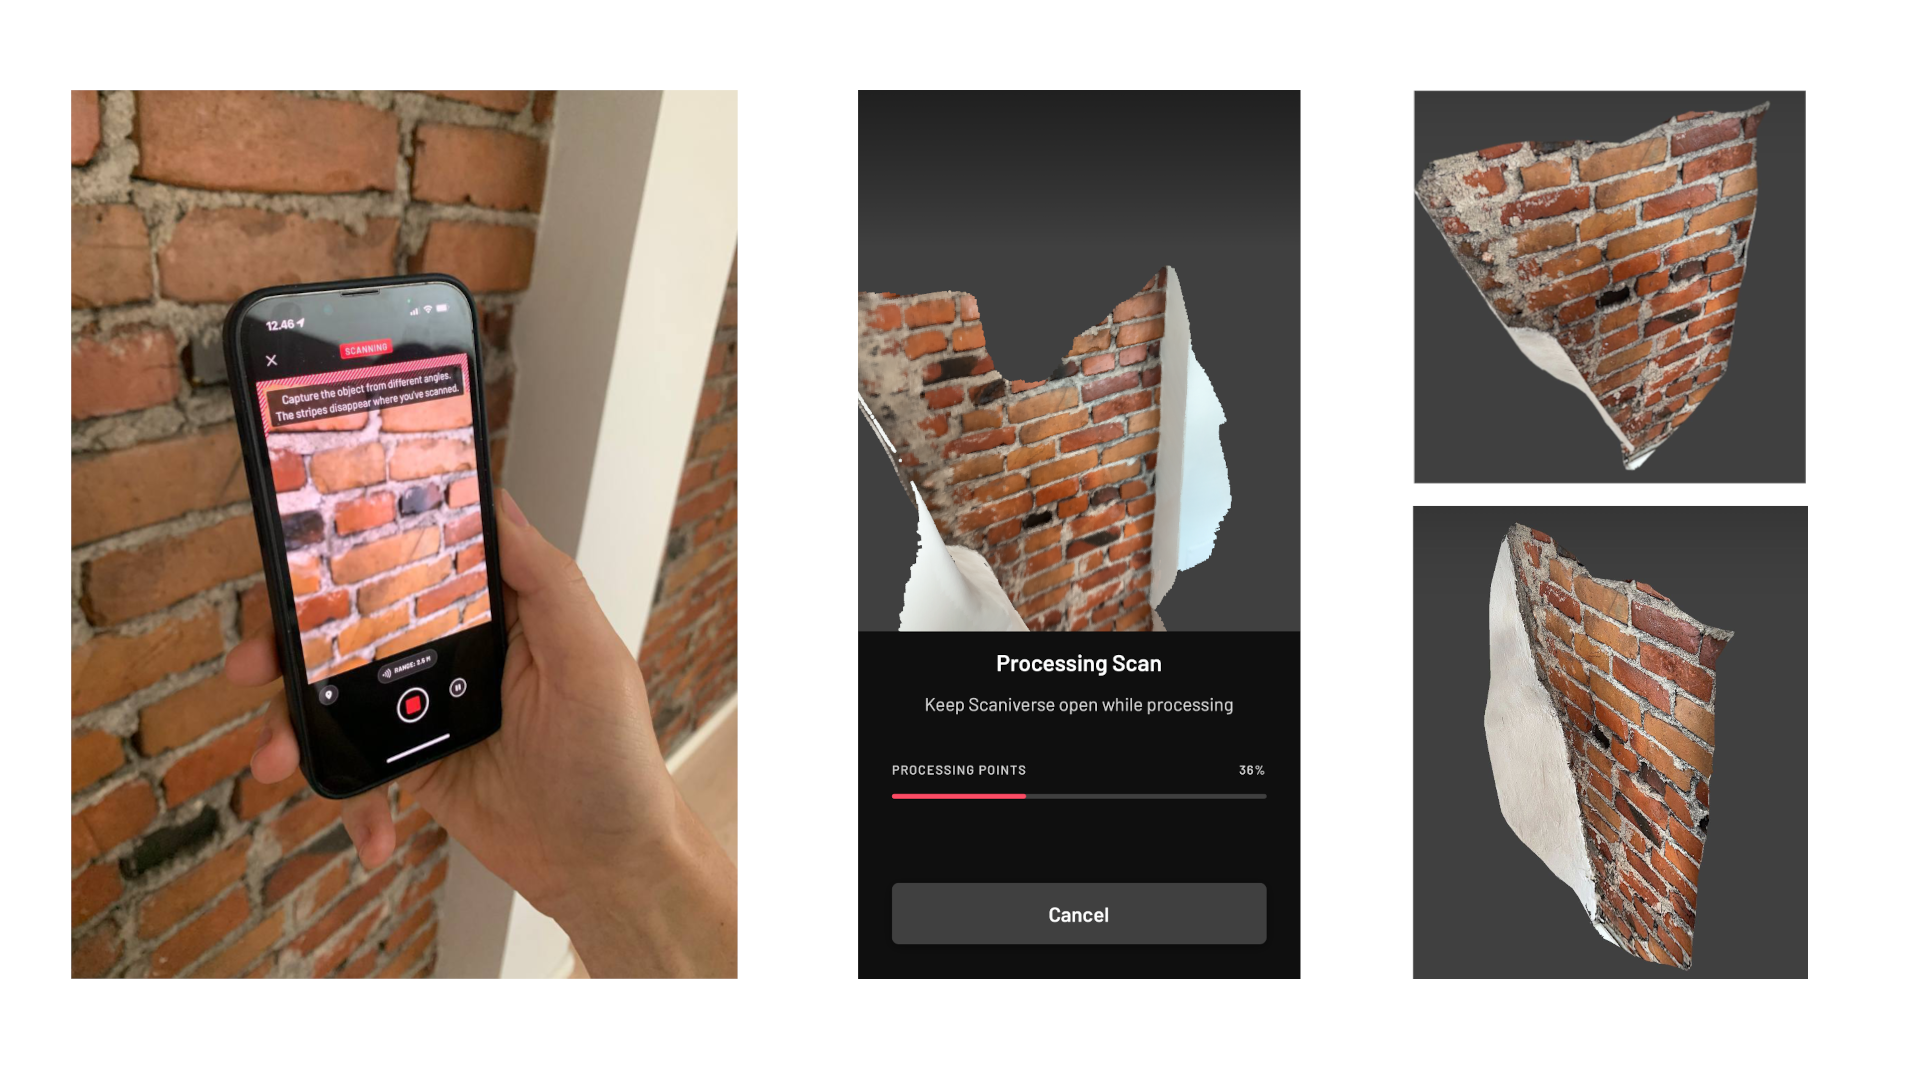
The most common methods for generating 3D point cloud data are using LiDAR, radar, and Photogrammetry. LiDAR (Light Detection and Ranging) sensors use a pulsing laser to measure an object’s distance from the lidar based on the time it takes for the light to bounce back to the LiDAR unit. Combining this with the location of the sensor, and its directionality, the 3D location from where the pulse was reflected can be calculated. The LiDAR sensor can be static on the ground or attached to a moving object such as a plane or a car. In the latter case, extra care has to be taken to know the exact location and direction of the sensor. These days even modern iPhones come with a built-in Lidar
Oftentimes a color value as well as an intensity measure of how much of the laser beam is being measured for each point. Combining these with the depth information creates richer data and can increase the usefulness for solving machine learning problems.
Similarly to LiDAR sensors, radar can be used to create point cloud data. Instead of light, radar uses electromagnetic waves to detect objects. This can be beneficial compared to LiDAR sensors when detecting is necessary through objects that block light but not radio waves. One place where both light and radio waves cannot penetrate far enough is underwater. Here sonar could be used to create point clouds using the same principles as LiDAR or radar.
The last common method is photogrammetry. This method creates a 3D image by interpreting multiple 2D images of an object. This is analogous to how humans see in 3D. These images usually have a much lower resolution compared to the previously discussed methods but are generally much cheaper to create. For example, Google Earth uses photogrammetry to create a 3D image of buildings based on satellite images.
What machine learning tasks can we do on point clouds?
There is a point cloud, now what? Most problems on point cloud data that we can solve with machine learning fall into one of three categories: classification, segmentation, and localization. This section will discuss each of the three problems and how to solve them.
Classification
Classification is the task of detecting what object is in the point cloud. For example, products coming down a factory conveyor belt can be scanned and classified whether they are good or bad based on its shape. In this case, the point cloud only contains a single object to be classified into a class. Of course, the number of possible classes can be bigger than two.
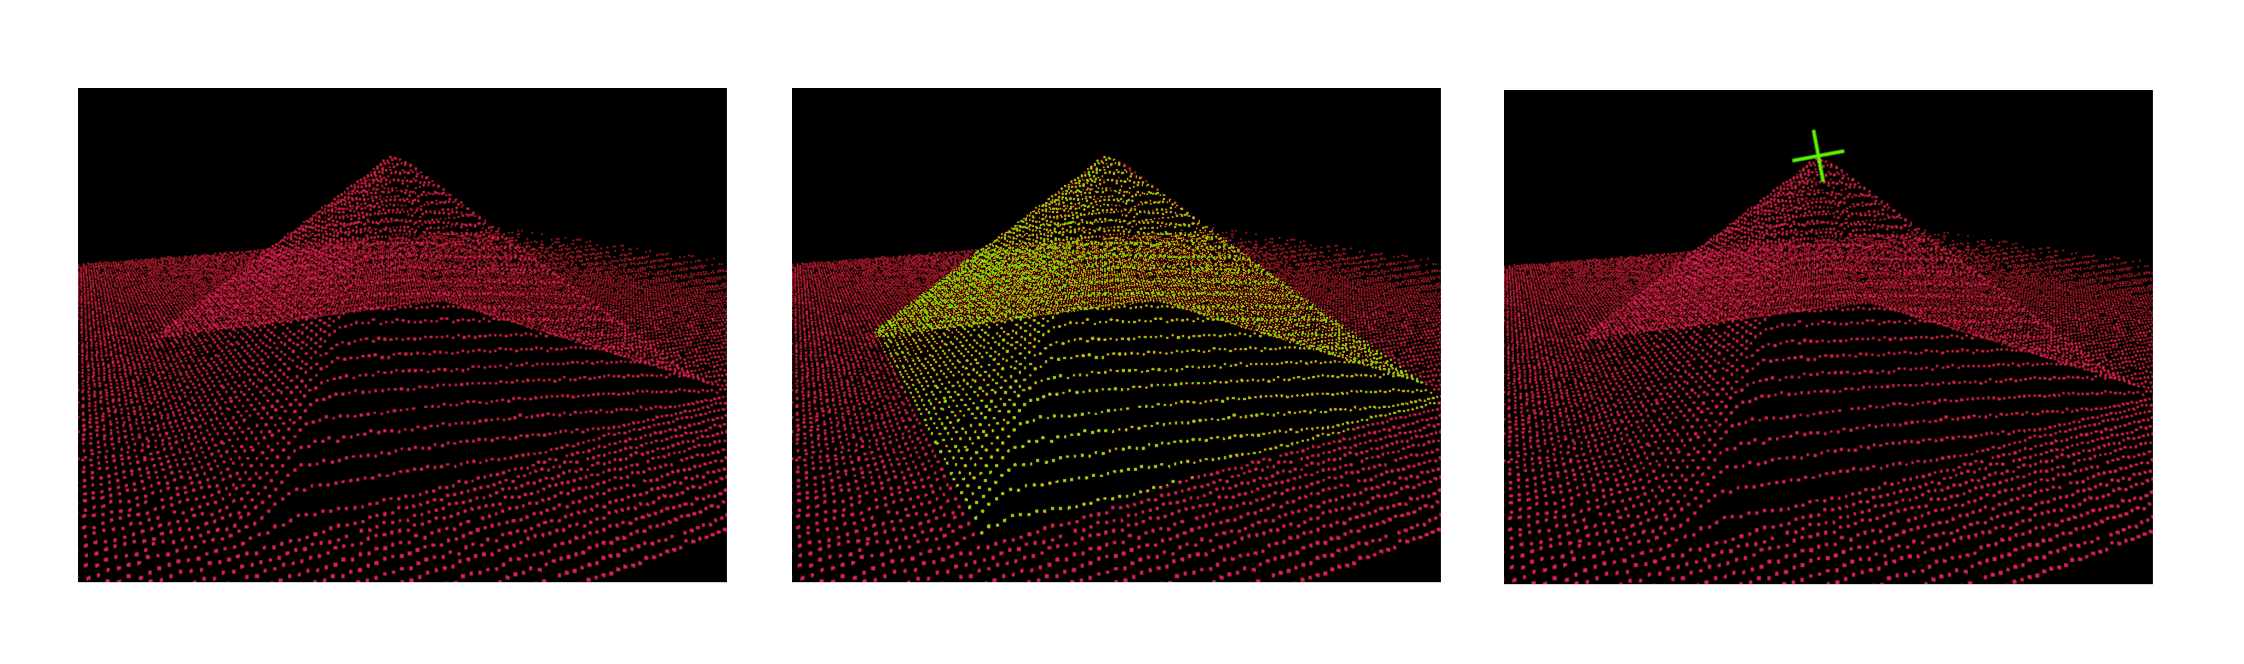
Segmentation
Segmentation concerns itself with dividing a point cloud into recognizable parts. This can be done at two levels. The first level is part segmentation. Here the task is to segment an object into recognizable parts. For instance, we know that the object is a table but find the points that are part of the top of the table and which points are part of the legs. The second level is semantic segmentation. Instead of segmenting a single object into its separate parts, semantic segmentation is the task of dividing a point cloud with multiple objects into distinct objects, for example, dividing a scene that is created by a self-driving car into pedestrians, other cars, buildings, busses, etc. so that the car knows what kind of objects are around.
Localization
Object localization tasks are not often mentioned in the classic academic point cloud algorithms but can prove extremely useful. The goal of the task is to pinpoint a specific location on an object. This could for example be useful on a factory line where a robot has to interact with a specific part of an object. Each object will be the same but there might be variations in the exact location which the robot has to account for. Furthermore, if we can localize an object over time, it is possible to track the object’s trajectory.
So how do we solve these problems using machine learning?
One way is to turn to proven efficient techniques from computer vision utilizing convolutional neural networks (CNNs). From a 3D point cloud, it is possible to create a 2D depth map by essentially looking at the point cloud from a top-down birds-eye perspective. This creates an image where each pixel represents a column of the point cloud. Information about the height, number of points, reflectivity, or other characteristics can be encoded in separate channels just like a color image has a red, green, and blue channel.
The analogous structure of 2D pixels in 3D is voxels. Instead of a grid of 2D pixels, the point cloud can be represented as a grid of 3D boxes. Because the grid has a regular structure, voxels close to each other contain information about that region of the point cloud. Just like for 2D images, CNNs can be used to solve our tasks. However, the size of the image in a voxel-based approach scales cubically with the size of the point cloud compared to quadratically for 2D pixels. This makes using voxels significantly slower due to the increased overhead.
Creating a 2D picture is a good representation to use for machine learning tasks because it is a well-studied use case. Point clouds are however closer to what humans see. Machine learning using a 3D point cloud as input without processing it into a regular grid structure cannot rely on this structured nature. At the core of most solutions built upon unaltered point clouds lies PointNet (or its extension PointNet++) which deals with the unordered nature of point clouds. The next section will go deeper into the workings of this PointNet. For more information on the pixel, voxel, and other approaches check out this document by Kyle Vedder.
PointNet
The PointNet architecture is designed to create a global representation of the whole point cloud in a single vector by using only permutation invariant operations. Most importantly the aggregation function cannot rely on the order of the input. PointNet uses max pooling to create the global representation (no matter what the order is, the maximum will always be the same).
With the global representation, we can now add the final part of our network depending on the task we want to perform. For classification, we add a classification head that predicts to which class the whole point cloud belongs to.
If the goal is to predict the location of an object in a space we can add a regression head after the global representation. Using supervised learning methods this regression head can learn the exact location of a feature of the point cloud. For example, pinpoint the center of a wheel of a car and give its x,y, and z coordinates.
For segmentation, the model architecture can be similar to the classification architecture. However, instead of classifying the whole point cloud, segmentation requires the classification of each point. What makes segmentation tasks more challenging is that the global representation created by the PointNet might not contain enough fine-grained information about the object. One way to alleviate this problem is to concatenate the earlier layer’s output to the global feature vector to also have information about earlier, less global, abstractions. This works reasonably well for many cases but for more challenging segmentation problems PointNet++ was created to deal with this problem.
This post will not explain PointNet++ in full detail. If you are interested, I highly recommend reading the original paper, or slides and youtube videos made by Maziar Raissi about PointNet and other point cloud methods. In brief, PointNet++ clusters points in the point cloud and applies a mini-PointNet to each cluster instead of the whole point cloud. This ensures that more local information is retained and segmentation can perform better.
Final thoughts
Point clouds are a great way to represent a 3D environment. Tasks that can be defined as a classification, segmentation, or localization task can be solved with the help of a PointNet. However, simply having a digital representation of a real-life environment can already be beneficial. For example, creating point clouds at different points in time allows for easy comparison of a 3D object. Furthermore, it is easy to zoom in on or rotate a digital object which might be difficult to do in the real world. As an additional benefit, most methods of creating point clouds are inherently more private compared to photos or videos because no personal data can easily be gathered from a point cloud.
Emblica is not your average data team. We build customized solutions for collecting, processing, and utilizing data for all sectors, especially at the R&D interface. Whether our target is a factory line, an online store, or a field, you can find us busy at work, hands in the clay - at least at our office in Helsinki.